DEGRADATION:
HOW MUCH TIME LEFT?
Indonesia’s biodiversity richness is made possible by several factors: it is located between two continents (Asia and Australia) and two oceans (Pacific and Indian) and it has a unique geographical feature (State Ministry of Environment, 1997). Indonesia is an archipelago of more than 17,000 islands extending 5,000 km along the equator and spanning two major biogeographical realms (Indomalaya and Australasia)
|
|
with the Wallace Line in between, as well as several distinct biogeographical provinces. As a result, Indonesia is not only a megabiodiversity country but also has a high level of endemism. Table shows Indonesia’s estimated biotic richness.
There are seven major biogeography regions in Indonesia, centered on the major islands and groups and their surrounding seas. Those regions are: 1) Sumatra and off-shore islands, 2) Java and Bali, 3) Kalimantan, including Natuna and Anambas islands, 4) Sulawesi, and offshore islands including Sula, 5) Nusa Tenggara, 6) Maluku, and 7) Irian Jaya. There are 14 habitat types in Indonesia that consist of peat swamp (PS), freshwater swamp (FS), montane rainforest (MF), mangrove forest (Mn), monsoon forest (MSF), lowland evergreen rainforest (LR), alpine (Alp), forest on limestone (FL), semi-evergreen rainforest (SER), heath forest (HF), forest on ultra basic (UB), tropical pine forest (TPF), ironwood forest (IF) and savanna (Sav) habitats. Those habitats originally covered 1,895,512 km2 of Indonesia’s land (MacKinon and MacKinnon in Bappenas, 1993). The three major biodiversity centers are Irian Jaya (high species richness and endemism), Kalimantan (high species richness, moderate endemism), and Sulawesi (moderate species richness, high endemism). Irian Jaya has 7 types of habitats (Alp, MF, LR, LF, FS, PS, Mn), Kalimantan has 8 types (FL, FS, HF, IF, LR, MF, Mn, PS) and Sulawesi have 9 type habitats (FL, FS, LR, MF, MSF, Mn, PS, SER, UB). Table 10 shows the comparison among those regions.
Table. Estimated Indonesian biotic richness
Groups |
Number of Species in Indonesia |
Total World Species |
Flowering plants |
25,000 |
250,000 |
Insects |
250,000 |
750,000 |
Mollucas |
20,000 |
50,000 |
Fish |
8,500 |
19,000 |
Amphibians |
1,000 |
4,200 |
Reptiles |
2,000 |
6,300 |
Birds |
1,500 |
9,200 |
Mammals |
500 |
4,170 |
Source: KLH and McNeely in Bappenas (1993)
Various factors cause deforestation in Indonesia, such as smallholders agriculture and shifting cultivation, transmigration, infrastructure development, tree crop plantation and timber sector, but the relative importance of government programs and commercial interest is increasingly being accepted (Sunderlin and Resosudarmo, 1997). Barber and Schweithelm (2000) argued that the deforestation in Indonesia was underlined by “bad governance” on forestry sector development. They identified four most important policies on forestry development that affected the recent and on going forest degradation:
• The logging industry
• The government push, since 1990s, toward rapid development of industrial timber plantation to supply raw materials for the growing pulp and paper industry
• The rapid development of oil palm plantations
• The government transmigration program
Commercial logging has played a leading role in deforestation and forest degradation in Indonesia. The lack of implementation of rules and regulations governing concession contracts provides strong incentive for the concessionaires not to adopt sustainable practices (World Bank, 2000). Few concession-holders properly allow the silviculture practice and selective cutting system mandated by their concession agreements (Barber et al in Barber, 1996). Prakosa (1996) stated that this violation included limited activities in standing stock inventory, lack of enrichment planting, cutting outside area defined in annual working plan or in the rate exceed annual cutting target, re-logging before the planned period and high grading.
The logging activities have conducted an inefficient extraction of timber, unnecessary damage to remaining trees, excessive waste wood left in the forest, soil erosion and river pollution. The concessionaires show little interest to reduce timber waste, mitigate environment impact, and manage their concession sustainably. The World Bank reported that for every cubic meter cut, at least an equal amount of usable wood is left behind and that at least 8 million m3 are left rooting in the forest every year (Barber and Schweithelm, 2000). This reckless logging activities also made the forest vulnerable for fire by providing abundant easily combustible material that covered much of the forest floor. Reckless logging transformed the fire-resistant primary rainforest into a degraded and fire-prone ecosystem13.
These facts show that concessionaires are simply not interested in a second, less profitable cut that would require years of costly interim management and protection (Barber et al in Barber, 1996). Sunderlin and Resosudarmo (1997) argued that method applied in the license distribution that allow concessionaires to obtain very large concession area combines with certain policies that encourage rent seeking behavior among concessionaires reduce the incentive for long term sustainable forest management. Thiele in Sunderlin and Resosudarmo (1997) explained that low concession fees motivated the concessionaires to “possess” very large concession area. The possession of such abundant tract of land will reduce the needs for good concession management. On the other hand, low royalty payment allows the concessionaires to extract most of the economic rent in forest production. The opportunity toconcessionaires through corruption and violation of previous agreement in maintaining the sustainability of forest resources (Thiele in Sunderlin and Resosudarmo, 1997). The low rent capture by the government undervalued the forest and encourages bad management practice (Ascher in Sunderlin and Resosudarmo, 1997). In the end, it drives the concessionaires to relog their concession prematurely to maximize the rent extraction during their 20-year concession period.
This bad management led to the degradation of the resources. The decline in the amount of official annual cut from concession area indicate it. According to Ministry of Forestry data, timber production level realized under concessionaires approved annual work plan (RKT) dropped from just under 24 million m3 in 1990/1991 to 15 million m3 in 1996/1997. This 37,5% drop in RKT output at the national level was, in fact, surpassed by the declines recorded for many of Indonesia’s major timber-producing provinces. RKT level for Central Kalimantan fell by 32%, while East Kalimantan dropped by 48% and Riau fell by 79% during this period (Barr, 2000). Some part of the decline is affected by the declining number of active HPHs in operation, but the declining potency of standing stock is also give significant contribution.
The case of HTI management is not very different with the HPH’s. Following the ambitious plan to establish vast areas of fast-growing timber plantations, many forestry companies assumed an inordinate degree of risk by investing large sums of capital in wood processing industries without first securing a legal supply of raw materials that can be sustained over the long term. Between 1988-1997, conglomerates invested approximately US$ 8 billion in the pulp and paper sub-sector too raise the pulp industry’s processing capacity from 605,000 to 3.9 million tons/year and the paper industry’s capacity from 1.2 to 7.2 million tons/year (APPKI in Barr et al., 1999). However, they failed to develop plantations at this same pace. Instead, most producers have chosen to obtain a large portion of their fiber by clear cutting natural forests (Barr et al., 1999).
There is thus a significant mismatch between capacity and supply for Indonesia’s pulp industry due to the creation of large capacity mills in area that may not be able to supply them adequately, and an inadequacy of a timber planting program to meet the demand for the timber for pulp (World Bank, 1999). This discrepancy heightened the dependency of timber from clear felling/clear cutting practice through the issuance of IPK license and became the source of misuse in the HTI implementation. HTI scheme became the justification of excessive demand of IPK license. The fact shows that Indonesia’s pulp industry currently consumes the equivalent of 15 million m3 of roundwood per year with only 3% of that comes from plantation. Between 20 and 40% of pulp mills’ raw material comes from legal clear cutting of mixed tropical hardwoods under the IPK licensing system, while nearly all of the rest comes from undocumented and presumably illegal sources (Scotland et al., Brown, ITMFP in Barr et al., 1999). The concessionaires then often use HTI scheme to cover their bad HPH management practice (Barber et al in Barber, 1996). As the World Bank points out “logging operations can degrade a site with little risk of serious penalty, and in the process set them up to receive a license to convert the site so damaged into a HTI or tree crop estate” (Barber and Schweithelm, 2000)
This practice, unfortunately, was encouraged by the government. According to government regulation No. 7/1990, HTI development can take place within production forest, and the permit allows the holder to clear-cut a designated area and to replant it with commercial tree species (Barr et al., 1999). Ministry of Forestry also introducing regulation in 1992, requiring all Production Forest within a 100 km radius of a pulp mill to be used for pulpwood plantations. So, while the government’s policy is to establish HTI on degraded lands, the reality is that this are established in moderately logged-over forest areas (State Ministry of Environment, 1997). Something that allowed by Ministerial Decree 442/1992 that circumvents the original HTI regulations on converting productive natural forests and permits clear-cutting of significant stands of commercially valuable timber (World Bank, 1999).
Despite its professed intentions, timber plantation and its pulp industry has heightened the log consumption for forest industry. Indonesia’s major log consuming industries then became sawmill industry (for lumber or sawn timber), molding and building components, plywood and particleboard, and pulp and paper. The installed production capacities of the nation’s forest industry have created a demand for logs and fiber that substantially exceeds the supply capacity of Indonesia’s formal timber production apparatus (Barr, 2000).
This problem had been identified from the early 1990s. Ahmad (1995) stated that in 1995, there was already 19-22 million m3 supply deficit for forest industry. A steady decline in the volume of logs officially produced within the HPH system since 1990 widened the existing supply-demand gap and the existence of such a substantial structural timber deficit poses fundamental problems for the sustainable logging reform agenda. The structural demand for substantial volumes of timber above and beyond those generated by the official log supply is a central factor driving Indonesia’s illegal timber trade. Estimates of illegal log removals in recent years have ranged from 12 to 32 million m3 per year (Barr, 2000).
The last major cause for deforestation is the land conversion for non-forest use. The rapid expansion of oil palm plantations in 1990s has been the major force in this category (World Bank, 1999). The strategic importance of oil palm (foreign exchange earnings, domestic cooking oil supply, rural labor absorption) has made the sector top priority for the government (Casson in World Bank, 1999). Several schemes have facilitated the growth of the sector: state owned companies (started in 1968), support for smallholders through PIR (since 1978) and PIR-Trans (from 1986-1994), and support for large scale private estate (since 1986).
The area covered by these plantations grew from about 843,000 ha in the mid-1980s to more than 3 million ha in 2000. One third of oil palm plantations has been planted in the last five years (BPS in World Bank, 1999). Tthe growth of oil palm plantation area during the last ten year. Most plantations are currently I Sumatra, but Kalimantan is being rapidly developed and Irian Jaya is the primary target for future expansion (Barber and Schweithelm, 2000).
The conversion of forestland to oil palm plantations is not confined to land designated as conversion forest but frequently, in practice, include land designated as production forest (Barber and Schweithelm, 2000). It can be said that almost all of the existing oil palm plantation areas result from the conversion of production forest. This is because the procedure for acquiring forestland is relatively easy and the firm can clear cut and sell the standing timber as a profitable side business. Table 15 shows total forestland that have been converted for oil palm plantation until June 2001. From the data, it is clear that almost 80% of the existing oil palm plantation was establish by converting forestland.
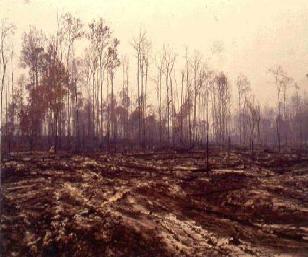
The use of fire for land clearance is also a significant negative impact that brought by the vast development of oil palm plantation. Burning is attractive to plantation firm because it removes waste wood and vegetation rapidly and require relatively little heavy equipment, technical expertise and operational cost (Wakker in Barber and Schweithelm, 2000). Indonesia’s haste to expand the oil palm industry has made land clearing for oil palm plantation the largest single forest fire risk factor in Sumatra and Kalimantan (Barber and Schweithelm, 2000).
FAO offered three scenarios of timber supply and demand that will affect the change of forest cover and deforestation in Indonesia (State Ministry of Environment, 1997). The first is the base scenario in which there are productivity gains in natural forests and plantations in Outer Islands, production gains in Java’s plantation, and increased utilization and development of estate crops and small-scale private plantations. The second is optimistic development scenario, which has all the assumptions of the base scenario with slightly more ambitious reforestation program. The third is the traditional scenario in which there is no improvement in forest management, no plantations, and no utilization of timber from estate crops and small-scale private plantations. FAO concluded that even if optimistic long-term forecasts are used, by the year 2030 some 25-30% of the forest cover of 1990 would be lost, mostly in production and conversion forest. Assuming the worst scenario, in which total deforestation is 0.8 million hectares per year, while reforestation and rehabilitation fails substantially, Indonesia would loose another 5.6 million hectares of forest by 2003 and 19.2 million hectares by 2020.
However, for several experts, the prospect is dimmer than that17. Some argued that with the current pressure from forest fire, illegal logging and forest conversion, Indonesia’s natural production forest will be in a critical point in 2005, and if an adequate reforestation program can not be implemented, the whole natural forest will be in critical condition in 2010. Unfortunately, this prediction might be true.
|
The current level of annual log harvest was above the predicted sustainable level on 22 million m318 and the recent decline was only caused by the degradation of the standing stock itself. The estimation by Whitten, as mentioned before, also supports that dime prediction. It was predicted that Sulawesi has lost all of its remaining lowland peneplain forest in 2000, followed by Sumatra in 2005, and Kalimantan in 2010. Heath forest was predicted to be disappear from Kalimantan in 2010, so did the wetland forest in Sulawesi in 2000.
Next >>> |
Source :
Disappearing Diversity: An Overview on Indonesia’s Degrading Forest and Its Biodiversity Indonesia Case Study. Paper prepared for an international workshop on "Integration of Biodiversity in National Forestry Planning Programme" held in CIFOR Headquarters, Bogor, Indonesia on 13-16 August 2001
by
Dermawan TRIWIBOWO
HARYANTO
|